Constructing a Model Set for Reccuring Events
In the previous post, I answered a question about how to set up a model set for binary churn. It is fairly common for data miners to find ways to express almost any problem as a binary outcome since binary outcome problems are easily approached with familiar tools such as logistic regression or decision trees. The context for the questions suggests an alternate approach, however. The event of interest was the purchase of refill pages for a calendar/planner. This is an example of a recurring event. Other examples include:
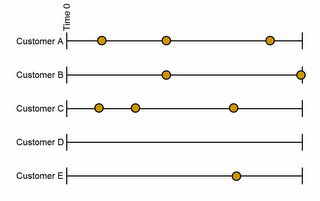
These are customers making multiple purchases during an observation window. Each time a customer makes a purchase, a transaction record is created. When we add this data to a table in the counting process style, each customer contributes several rows. There is a row for the time from time 0, which may be the time of the initial purchase, to the second purchase, a row for the time to each subsequent purchase, and a row for the time between the final observed purchase and the end of the observation period.
Depending on the style of analysis used, each event may be seen as starting a new time 0 with the number of previous events as a covariate, or each event may be modeled separately with a customer only becoming part of the at-risk pool for event n after experiencing event n-1.
Either way, it is important to include the final censored time period. This period does not correspond to any transaction, but customers are "at risk" for another purchase during that period.
My approach to creating the table is to first create the table without the censored observations, which is reasonably straightforward. Each of these rows contains a flag indicating it is a complete, uncensored observation. Next I create just the censored observations by creating an observation going from the latest observed purchase to the end of the observation period (in this case, 22May2006). The censored rows can then be appended to the uncensored rows. These could, of course, be turned into subqueries in order to avoid creating the temporary tables.
This fully expanded version of the data is what is referred to as the counting process style of input. In a realistic situation where there might be millions of customers, it makes more sense to group by tenure so that there is one row showing how many customers made a purchase with that tenure and how many customers experienced the tenure and so could have made a purchase. This is the data needed to estimate the intensity function.
In Gordon Linoff's book, Data Analysis Using SQL and Excel, he provides sample code for making a related, but different table using the data available on the book's companion page. I reproduce it here for reference.
The code uses the DATEDIFF function to subtract a household's first order date from all its other order dates to put things on the tenure timeline. It then counts the number of second (or third, or fourth, . . .) purchases that happen at each tenure. This query does not track the population at risk so it is not the actual intensity function, but it never the less gives a nice visual image of the way intensity peaks at yearly intervals as many customers make regular annual purchases, just as the purchasers of calendars in the previous posting did.
- Visits to a web page.
- Purchases of additional minutes for a pre-paid phone plan.
- Subscription renewals.
- Repeat purchases.
- Pregnancies.
- Incarcerations.
- Posts to a blog.
These are customers making multiple purchases during an observation window. Each time a customer makes a purchase, a transaction record is created. When we add this data to a table in the counting process style, each customer contributes several rows. There is a row for the time from time 0, which may be the time of the initial purchase, to the second purchase, a row for the time to each subsequent purchase, and a row for the time between the final observed purchase and the end of the observation period.
Depending on the style of analysis used, each event may be seen as starting a new time 0 with the number of previous events as a covariate, or each event may be modeled separately with a customer only becoming part of the at-risk pool for event n after experiencing event n-1.
Either way, it is important to include the final censored time period. This period does not correspond to any transaction, but customers are "at risk" for another purchase during that period.
My approach to creating the table is to first create the table without the censored observations, which is reasonably straightforward. Each of these rows contains a flag indicating it is a complete, uncensored observation. Next I create just the censored observations by creating an observation going from the latest observed purchase to the end of the observation period (in this case, 22May2006). The censored rows can then be appended to the uncensored rows. These could, of course, be turned into subqueries in order to avoid creating the temporary tables.
This fully expanded version of the data is what is referred to as the counting process style of input. In a realistic situation where there might be millions of customers, it makes more sense to group by tenure so that there is one row showing how many customers made a purchase with that tenure and how many customers experienced the tenure and so could have made a purchase. This is the data needed to estimate the intensity function.
In Gordon Linoff's book, Data Analysis Using SQL and Excel, he provides sample code for making a related, but different table using the data available on the book's companion page. I reproduce it here for reference.
The code uses the DATEDIFF function to subtract a household's first order date from all its other order dates to put things on the tenure timeline. It then counts the number of second (or third, or fourth, . . .) purchases that happen at each tenure. This query does not track the population at risk so it is not the actual intensity function, but it never the less gives a nice visual image of the way intensity peaks at yearly intervals as many customers make regular annual purchases, just as the purchasers of calendars in the previous posting did.
Labels: Ask a data miner
posted by Michael J. A. Berry at
7:44 PM
![]()

0 Comments:
Post a Comment
Links to this post:
Create a Link
<< Home