Thursday, September 27, 2007

How weird is customer 2439493?

Remember the 5 raters who rated more than 10,000 movies each? It is important to know whether their opinions are similar to those of less prolific raters because for rarely-rated movies, theirs may be the only opinion we have to work with.

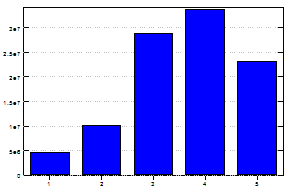
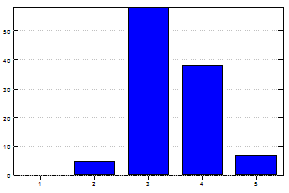
Here is the distribution of 2439493's ratings:

2439493


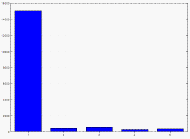
Customer 2439493 rated 16,565 movies and hated 15,024 of them! If he is an actual human, why does he watch so many movies if he dislikes them so much? If he actually watched all the movies and if the average running time was 1.5 hours, then he spent 22,536 hours watching movies he hated. If he did it as a full-time job, it would take him about 8 years.


This customer did like 334 movies (about 2%) well enough to give them a five. Other than a fondness for Christmas and Santa themed movies, it is hard to discern what his favorites have in common. Here is a partial listing:
    Rudolph the Red-Nosed Reindeer
  • Jingle All the Way
  • The Santa Clause 2
  • The Santa Clause
  • Back to the Future Part III
  • Frosty's Winter Wonderland / Twas the Night Before Christmas
  • Sleeping Beauty: Special Edition
  • Jack Frost
  • The Princess Diaries (Fullscreen)
  • The Little Princess
  • A Christmas Carol
  • The Passion of the Christ
  • Ernest Saves Christmas
  • Bambi: Platinum Edition
  • New York Firefighters: The Brotherhood of 9/11
  • Left Behind: World at War
  • The Year Without a Santa Claus
  • Miss Congeniality
  • National Lampoon's Christmas Vacation: Special Edition
  • Groundhog Day
  • Maid in Manhattan
  • Jesus of Nazareth
  • The Sound of Music
  • A Charlie Brown Christmas
  • Miracle on 34th Street
  • Mary Poppins
  • The Brave Little Toaster
  • The Grinch
This guy rated 16,565 movies and Miss Congeniality and National Lampoon's Christmas Vacation both made the top 2%! Representative? I hope not.

How does my ratings distribution compare?

Originally posted to a previous version of this blog on 18 April 2007.


mjab<--This is how my scores are distributed.


population


This is how scores are distributed in the population.-->


I have rated 110 movies--a few more than the median. My mode is 3 whereas the population mode is 4.

Thinking about my own data is not just narcissism; I have found it useful when looking at supermarket loyalty card data, telephone call data, and drug prescription data. I find it gets me thinking in more interesting ways.

For instance, I never give any movies a 1, so how come other people do? Couldn't they have guessed they wouldn't like that movie before seeing it? Personally, I never watch a movie unless I expect to like it at least a little. Ah, but that wasn't always the case! When my kids were young and living at home, I often suffered through movies that were not to my liking. Come to think of it, it is not only parents who sometimes watch things picked by other people. Room mates, spouses, and dates can all have terrible taste!

Outliers for number of movies rated

Originally posted to a previous version of this blog on 18 April 2007.

My raters signature has a column for the number of movies each subscriber has rated. In the J code below, this column is called n_ratings.

+/ n_ratings >/ 1000 5000 10000

In English, this compares each subscriber's number of ratings with the three values creating a table with three columns. The table contains 1 where the number of ratings is greater and 0 where it is less than or equal to the corresponding value. These 1's and 0's are then summed. The result vector is 13100 43 5.

The 13,100 people who rated more than a thousand movies are presumably legitimate movie buffs who have seen, and have opinions on, a lot of movies. Rating 10,000 movies does not seem like the expected behavior of a single human. Could these be the collective opinions of an organization? Or automatic ratings generated by a computer program? I don't know. What I do know is that such outliers should be treated with care. One concern is that for movies that have been rated by very few subscribers, the ratings will be dominated by these outliers.

There has been some discussion of this issue on the Netflix Prize Forum.

How many movies does each rater rate?

Originally posted to a previous version of this blog on 17 April 2007.

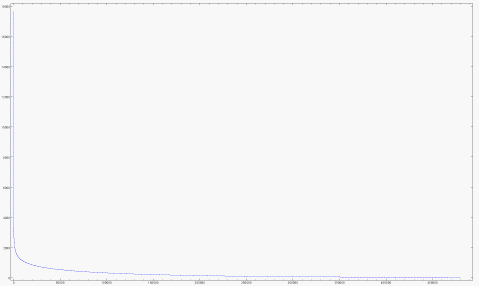
Part of my rater signature is how many movies the rater has rated. A few people (are they really people? Perhaps they are programs or organizations?) have rated nearly all the movies. Most people have rated very few.

movies rated

How Many People Rate Each Movie?

Originally posted to a previous version of this blog on 17 April 2007.

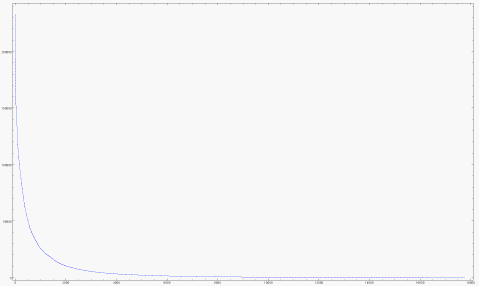
Part of my movie signature is a count of how many people have rated each movie. The number drops off very quickly after the most popular movies.


The mean number of raters is 5,654.5. The median number of raters is 561. As mentioned in an earlier post, the smallest number of raters for any movie is 3.

A Data Miner Explores the Netflix Data

Originally posted to an earlier version of this blog in April 2007.

For most data mining algorithms, the best representation of data is a single, flat table with one row for each object of study (a customer or a movie, for example), and columns for every attribute that might prove informative or predictive. We refer to these tables as signatures. Part of the data miner’s art is to create rich signatures from data that, at first sight, appears to have few features.

In our commercial data mining projects, we often deal with tables of transactions. Typically, there is very little data recorded for any one transaction. Fortunately, there are many transactions which, taken together, can be made to reveal much information. As an example, a supermarket loyalty card program generates identified transactions. For every item that passes over the scanner, a record is created with the customer number, store number, the lane number, the cash register open time, and the item code. Any one of these records does not provide much information. On a particular day, a particular customer’s shopping included a particular item. It is only when many such records are combined that they begin to provide a useful view of customer behavior. What is the distribution of shopping trips by time of day? A person who shops mainly in the afternoons has a different lifestyle than one who only shops nights and weekends. How adventurous is the customer? How many distinct SKU’s do they purchase? How responsive is the customer to promotions? How much brand loyalty do they display? What is the customer’s distribution of spending across departments? How frequently does the customer shop? Does the customer visit more than one store in the chain? Is the customer a “from scratch” baker? Does this store seem to be the primary grocery shopping destination for the customer? The answers to all these questions become part of a customer signature that can be used to improve marketing efforts by, for instance, printing appropriate coupons.

The data for the Netflix recommendation system contest is a good example of narrow data that can be widened to provide both a movie signature and a subscriber signature. The original data has very few fields. Every movie has a title and a release date. Other than that, we have very little direct information. We are not told the genre of film, the running time, the director, the country of origin, the cast, or anything else. Of course, it would be possible to look those things up, but the point of this essay is that there is much to be learned from the data we do have, which consists of ratings.

The rating data has four columns: The Movie ID, the Customer ID, the rating (an integer from 1 to 5 with 5 being “loved it.”), and the date the rating was made. Everything explored in this essay is derived from those four columns.

The exploration process involves asking a lot of questions. Often, the answer to one question suggests several more questions.

How many movies are there? 17,770.

How many raters are there? 480,189.

How many ratings are there? 100,480,507.

How are the ratintgs distributed?
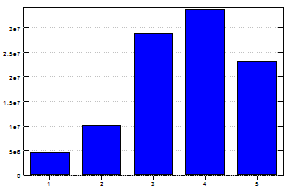
Overall distribution of ratings


When is the earliest rating? 11 November 1999.

When is the latest rating? 31 December 2005.

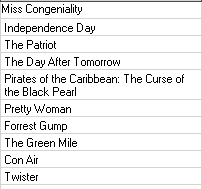
What are the top ten most often rated movies?

What are the ten least often rated movies?
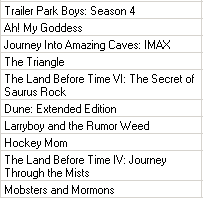

Mobsters and Mormons, the least often rated movie has been rated by only 3 viewers. It is one of two movies with raters in the single digits. Land Before Time IV is the other.

What is the most loved movie?

Lord of the Rings: The Return of the King: Extended Edition with an average rating of 4.7233.

What is the most disliked movie?

Avia Vampire Hunter with an average rating of 1.2879. This movie did not get a single 4 or 5 from any of the 132 people who rated it. The reviewers’ comments on the Netflix site are amusing: "Do you love the acting and plot of porn, but can't stand all the sex and nakedness, well then, this is the movie for you!”


How many movies account for most of the ratings?
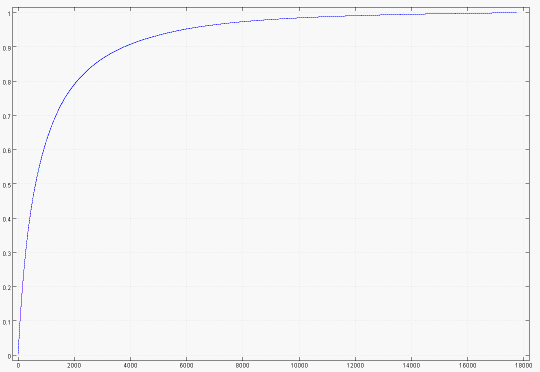

Cumulative proportion of raters accounted for by the most popular movies


The top 616 movies account for 50% of the ratings. The top 2,000 movies account for 80% or the ratings and the top 4,000 for 90%.
Thoughts on KDD Cup 2007 Task 2

Originally posted to an earlier version of this blog on 30 April 2007.

The next several entries in the Netflix Data thread will examine questions to do with the timing of ratings. These that will be important to anyone attempting task two of the 2007 KDD Cup data mining competition.

This task is to predict the number of additional ratings that users from the Netflix Prize training dataset will give to the movies in that dataset during 2006. Ratings in the training data are from 11 November 1999 through 31 December 2005, so the task requires looking into the future. In other words, a predictive model of some kind.

To build a predictive model, we divide the past into the distant past and the recent past. If we can find rules or patterns in a training set from the distant past that explain what occurred in validation set from the recent past, there is some hope that applying these rules to the recent past will produce valid predictions about the future.

Creating a validation set for predictive modeling is not as simple as it first appears. It is not sufficient to simply partition the training data at some arbitrary date, we must also take into account all the known ways that the recent past differs from the future. In this particular case, it is important to note that:

  • Past ratings--including those from the recent past--are made by a mix of new and old raters. New raters appear throughout the five-year observation period. The 2006 ratings in the KDD Cup qualifying set, by contrast, will all be made by old raters since the KDD Cup raters are a subset of the Netscape Contest raters. If new raters behave differently than old raters, the presence of ratings by new raters in the training and validation set is problematic.
  • Past ratings are of a mixture of old and new movies. New movies (and old movies newly released to DVD) appear throughout the five-year observation window. The KDD Cup qualifying set contains only old movies by definition since the movies in the qualifying set are a subset of the movies in the Netflix Contest observation window. If new movies are rated more (or less) frequently than old movies, the presence of new movies in the training and validation sets is problematic.
  • Only active raters rate movies. The ratings habits of individual subscribers change over time. The raters in the training data are all active raters in the sense that they have rated at least one movie or they wouldn't have a row in the trainings set. Over time, some of these raters will get tired of rating movies, or switch to Block Buster, or die, or move to Brazil. Understanding the rate at which active raters become inactive is central to the task.
  • As shown in an earlier post, the overall rating rate changes over time. In particular, is was declining at the end of 2005. If this can be explained by the changing mix of new and old raters and/or the changing mix of new and old movies, it is not a problem. If it is due to some exogenous effect that may or may not have continued during 2006, it is problematic.

The next few posts will examine these points.