After taking a break from speaking at conferences for a while, I will be speaking at two in the next month. Both events are here in Boston.
This Friday (9/14) I will be at Big Data Innovation talking about how Tripadvisor for Business models subscriber happiness and what we can do to improve a subscriber's probability of renewal.
On October 1 and 2 I will be at Predictive Analytics World in Boston. This has become my favorite data mining conference. On the Monday, I will be visiting with my friends at JMP and giving a sponsored talk about how we use JMP for cannibalization analysis at Tripadvisor for Business. On Tuesday, I will go into the details of that analysis in more detail in a regular conference talk.
Tuesday, September 11, 2012
Sunday, March 11, 2012
Measuring Site Engagement: Pages or Sessions
One of our clients is a large media website that faced a simple question: What is the best way to find the most engaged users on the web site? The goal was to focus a marketing effort on these users.
A media web site is challenging, because there is no simple definition of engagement or customer worth. The idea is that engagement can either lead to more advertising views or to longer subscriptions, depending on the business model for the site. On the other hand, for a retailing site, the question is simpler, because there is a simple method to see who the best customers are. Namely, the amount of money they spend.
Engagement is a nice marketing concept, but how can it be defined in the real world? One way is to simply look at the number of page views during some period of time. Another is to look at the number of sessions (or alternatively days of activity if sessions are not available) during a specified period of time. Yet another is to measure breadth of usage of the site over a period of time: Does the user only go to one page? Is the user only coming in on referrals from Google?
The first analysis used one month of data to define engagement. The top users for one month were determined based on pages and sessions. Of course, there is a lot of overlap between the two groups -- about 60% of the top deciles overlapped.
Which group seems better for defining engagement, the top users by page views or by sessions? To answer this, let's borrow an idea from survival and measure how many users are still around nine months later. (Nine months is arbitrary in this case). In this case, the return rate for the top decile for sessions was 74.4% but for the top decile for pages was lower at 73.8%. Not a big difference, but one that suggests that sessions are better.
Actually, the results are even more striking for visitors who are not in both top deciles. For the non-overlapping group, the session return rate is69.6% versus 67.9% for the page deciles.
For defining engagement, we then extended these results to three months instead of one to find the top one million most engaged users. The three measures are:
- Visitors that have the most page views over three months.
- Visitors that have the most sessions over three months.
- Visitors in the top tercile of sessions (third) in each month, then take the highest terciles.
Three months was chosen as a rather arbitrary length of time, because the data was available. Holding it constant also lets us understand the difference between sessions and page views.
These three methods all produced about the same number of visitors -- the goal was to find the top one million most engaged users.
By these measures, the top one million visitors chosen by the three methods had the following "return" rates, nine months later:
- Page views in three months: 65.4%
- Sessions in three months: 65.9%
- Sessions over three months: 66.9%
The nine-month survival suggests that the sessions over three months is the better approach for measuring engagement.
Tuesday, February 14, 2012
Using Matched Pairs to Test for Cannibalization
When a company introduces a new product into the same
market served by an existing one, it is possible that the new product will
achieve success at the expense of the first. For example, when Netflix
introduced movie downloading, it knew it would put a dent in DVD subscriptions. This is
called cannibalization. Here at TripAdvisor, I recently did a study to
determine whether this was occurring on our sites.
A good methodology to use for this kind of study is matched pairs. This allows you to
isolate the effects of a single variable while controlling for many others. The
idea is simple: To measure the effect of a treatment, you take pairs of
subjects who are similar in every way and give the treatment to one, but not
the other. In medical studies, twins come in handy for this purpose.
To simplify slightly, at TripAdvisor we have two ways to
generate revenue from the millions of travelers who come to one of our sites to
read reviews: they can click on link A to be taken to an on-line travel agency
which pays us for the referral or they can click on link B to be taken directly
to the site of a hotel that has subscribed to our business listing product. So
the question is “Does the presence of link B have an effect on the number of
clicks received by link A?” To answer this question, each property with a
business listing is paired with a “twin” that does not have a business listing.
The result is two cohorts with extremely similar distributions of average daily
rate, number of reviews, amount of traffic on review page, number of rooms, and
everything else I could think of that might influence clicks on link A. Since
the only consistent difference between the cohorts is the presence or absence
of link B, any statistically significant difference in Link-A clicks can be
attributed to the presence of the business listing.
Why not just
compare a random sample of hotels with links A and B with a random sample of
hotels with only link A? Such a
comparison would be very flattering to link B; on average, hotels with a
business listings subscription perform better than those without one on all
kinds of metrics including clicks on link A. This is not surprising. Business
listings do not appeal to all properties equally, nor have they been marketed
with equal vigor in all markets and market segments. Such a study cannot
distinguish between a difference caused
by link B and one that is merely correlated
with link B. For example, perhaps link B appeals more to hotels in high-traffic
destinations and those same properties also attract more clicks of all kinds
Why not do a
longitudinal study? The goal would be to compare the click rate before and
after link B goes live on a hotel’s review page. The problem with this approach
is that though the change in click rate is easy to measure, it is hard to
interpret. The quantity of clicks varies over time for all sorts of reasons
that have nothing to do with the presence or absence of a business listing. In
addition to seasonality, there is trend: The ever increasing number of
TripAdvisor users means that clicks will tend to increase over time. Add to
that the effects of marketing campaigns, competition, changing exchange rates,
and political factors and there is a lot of noise obscuring whatever signal is
in the data. A cross-sectional study controls for all that.
How is similarity
measured? The matched pairs
methodology calls for each subscriber to be paired with the non-subscriber most
similar to it. For this study, there is a list of features that must match
exactly and another list of features which, as a group, must be “pretty close.”
The exact match features are categorical. The pretty close features are
numeric.
Exact match
features
·
Same price business listing.
·
Same geographic region.
·
Same category (Hotel, B&B, Specialty
Lodging).
·
Same chain status (a Hilton can match a
Marriott, but neither can match an independent property).
·
Matching properties are both on the first page
of listings for a destination or both on some other page.
·
Presence or absence of reviews supplied by our
users.
Hotels that match on all of the
above are candidates for matching. A hotel’s actual match is its closest neighbor as determined by the “pretty close” features. The exact match features control
for many variables that are not mentioned explicitly. For example, the price
charged for a business listing depends on the popularity of the destination and
the size of the property so hotels in the same pricing slice are similar in
size and traffic. Matching on geography controls for currency, climate,
language, and much else.
Pretty close
features
·
Average daily rate.
·
Number of rooms.
·
Popularity ranking.
·
Review page views.
The values of these features place each property at a
point in a four-dimensional space so it is easy to calculate the Euclidean
distance between any pair of properties. The closest candidate by Euclidean
distance is picked as the match. Because the features are all measured on
different scales, they must first be standardized to make distance along one
dimension comparable to distance along any other.
A few pairs are so well matched that, according to this
measure, they are distance 0 from each other.
The hotels on the left have business listings. The ones on
the right are their twins without business listings. Podere Perelli and Agriturismo
il Borghetto are twins because each has 12 rooms, each got exactly 72 page
views during the observation period, and each is seventh on its page.
The results
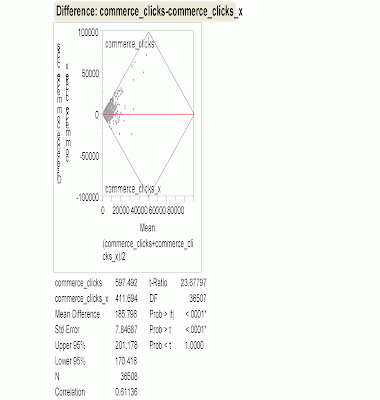
Deciding on the distance metric and creating the matched
pairs was most of the work. Once I had the pairings, I loaded 36,000 closely
matched pairs into JMP, a data exploration and analysis tool that includes a
matched pairs module.
In the diamond-shaped chart, the horizontal axis
represents increasing number of clicks on link A (“commerce clicks” in the
figure). To the left, where the number of clicks is low, there are some dots
below the red line indicating pairs where the non-subscriber got more link-A
clicks, but as the number of clicks increases, the business listings subscriber
nearly always wins.
In conclusion, after controlling for differences due to
geography, traffic, popularity, hotel category, number of rooms, presence or
absence of reviews, appearance on page one, and average daily rate, we counted
the number of clicks each twin received during a fixed observation period. There
was a statistically significant difference in the number of clicks on link A.
The average number of clicks for business listing subscribers was 597.49. The
average number for non-subscribers was 411.69. This is good news for our
subscribing hoteliers: In addition to the traffic we drive directly to their
sites, they see increased indirect traffic as well.
Tuesday, January 17, 2012
Writing to a text file from SQL Server
It has been a while since I've contributed to the blog . . . not because I've had nothing to say. In this time, I've been spending a lot of time working with SQL Server, producing useful stored procedures (and insights). In this post, I discuss one of them, a stored procedure in SQL Server to write text to a file.
This stored procedure is a utility. I learned a lot along the way while trying to write it. This post is intended to explain these learnings.
The approach that I'm taking is to use xp_cmdshell to write one line at a time using the DOS echo command. A different approach uses OLE automation and the File System Object. I couldn't get this to work, possibly because it requires configurations that I don't know about; possibly because I don't have the right permissions.
My stored procedure is called usp__AppendToFile and the code is at the end of this post. If you care about naming conventions, here is the reasoning behind the name. The "usp" prefix is for user stored procedure. Starting a stored procedure with usp or sp seems redundant to me, but appears to be a common and perhaps even a best practice. The double underscore is my convention, saying that this is a utility. It is then followed by a reasonable name.
usp__AppendToFile does the following: It takes a string (varchar(max)) and an optional end-of-line character. It then writes the string, one line at a time, using the echo command in DOS. By passing in the end of line character, the stored procedure can work with text that uses the DOS standard end of line (carriage return followed by line feed, the default) as well as other standards.
Although seemingly simple and using familiar tools, I learned several things from this effort.
My first lesson is that in order to write to a file, you need to be able to access it. When running you a command in SQL Server, it is not really "you" that needs permissions. The SQL Server service needs to be able to access the file. And this depends on the user running the service. To see this user, go to the Control Panel, choose the Administrative Tools, and select Services. Scroll down to find the SQL Server service (called something like SQL Server Agent), and look in the column Log On As.
As an example, the user running the service on one machine used a local machine account rather than a Windows verified domain account. For this reason, SQL Server could not access files on the network. Changing the service to run on a Windows-authenticated enabled SQL Server to create a file. (The alternative of changing the permissions for the user was not possible, since I do not have network sys admin privileges.)
The second lesson is that in order to write to a file using xp_cmdshell, you need to have xp_cmdshell enabled as shown here. There are good reasons why some DBAs strongly oppose enabling this option, since it does open up a security hole. Well, actually, the security hole is the fault of Microsoft, since the command is either enabled or disabled at the server level. What we really want is to give some users access to it, which denying others.
Third, the DOS way to write text to a file is using the echo command. Nothing is as simple as it seems. Echo does generally write text. However, it cannot write an empty line. Go ahead. Open a CMD shell, type in echo and see what happens. Then type in echo with a bunch of spaces and see what happens. What you get is the informative message: ECHO is on. Thanks a bunch, but that's not echoing what was on the command line.
I want my procedure to write blank lines when it finds them in the string. To fix this problem, use the echo. command. For whatever reason, having the period allows an empty line to be written. Apparently, other characters work as well, but period seems to be the accepted one.
The problems with DOS seem solved, but they are not. DOS has another issue: some special characters are interpreted by DOS, even before echo gets to them. For instance, > is interpreted to put the results to a file; | is interpreted as a pipe between commands, and & is interpreted as a background command. Fortunately, these can be escaped using the DOS escape character, which I'm sure everyone knows is a caret (^).
But, this issue does not end there, because special characters might be in a string, in which case they do not need to be escaped. Parsing a string in a stored procedure to find quotes is beyond the range of this stored procedure. Instead, if there are no double quotes in the string, then it escapes special characters. Otherwise, it does not.
Combining these lessons, here is what I consider to be a useful utility to write a string to a text file, even when the string consists of multiple lines.
CREATE procedure usp__AppendToFile (
   @str varchar(max),
   @FileName varchar(255),
   @EOL varchar(10) = NULL
) as
begin
   if @EOL is NULL
   begin
       set @EOL = char(13) + char(10);
   end;

   -- the period allows for empty lines
   declare @prefix varchar(255) = 'echo.';
   declare @suffix varchar(255) = '>>'+@FileName;

   -- Escape special characters so things work
   -- But escapes work funny when in double quotes (and maybe single quotes too)
   set @str = (case when charindex('"', @str) = 0
                    then replace(replace(replace(@str, '|', '^|'), '>', '^>'), '&', '^&')
                    else @str
               end);

   while (@str <> '')
   begin
       declare @pos int = charindex(@EOL, @str);
       declare @line varchar(8000) = (case when @pos > 0 then left(@str, @pos) else @str end);
       set @str = (case when @pos > 0 then substring(@str, @pos+2, 1000000) else '' end);

       set @line = @prefix+@line+@suffix;

       --write @line to file;
       exec xp_cmdshell @line;

   end;
end;  -- usp__AppendToFile
Saturday, October 1, 2011
The Average Hotel Does Not Get The Average Rating
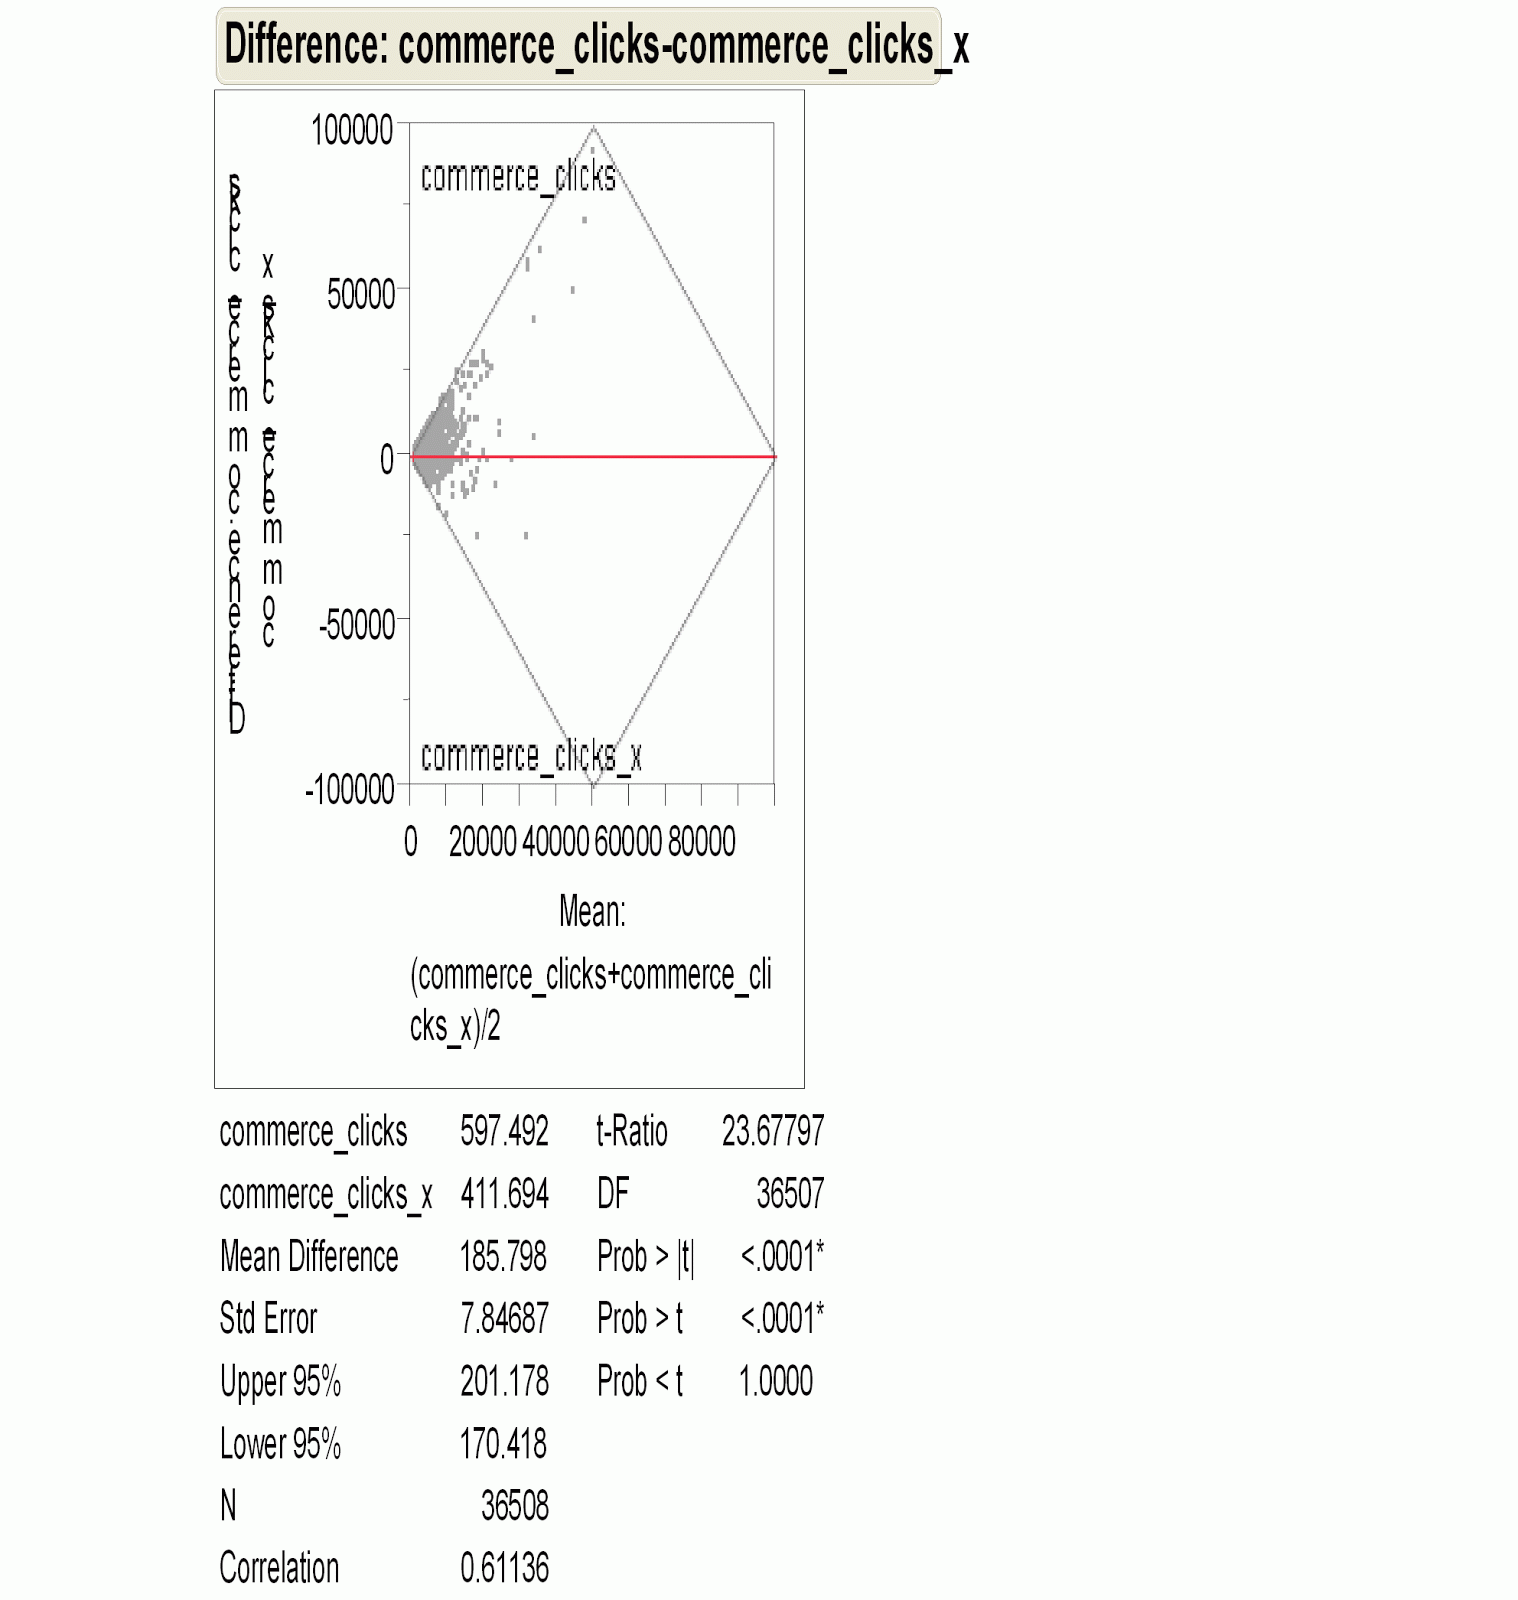
The millions of travelers who review hotels, restaurants, and other attractions on TripAdvisor also supply a numeric rating by clicking one of five circles ranging from 1 for "terrible" to 5 for "excellent." On the whole, travelers are pretty kind.The average review rating for hotels and other lodgings is over 3.9. The median score is 4 and since that middle review is lost somewhere in a huge pile of 4-ratings, well over half of hotel reviews give a 4 or 5 rating.
So with such kind reviewers, most hotels must have a rating over 4 and hoteliers must all love us, right? Actually, no. The average of all hotel ratings is 3.6. Here's why: some large, frequently-reviewed hotels have thousands of reviews. It is hardly surprising that the Bellagio in Las Vegas has about 250 times more reviews than say, the Cambridge Gateway Inn, an unloved motel in Cambridge, Massachusetts. It may or may not be surprising that these oft-reviewed properties tend to be well-liked by our reviewers. Surprising or not, it's true: the hotels with the most reviews have a higher average rating than the long tail of hotels, motels, B&Bs, and Inns with only a handful of reviews each.
The chart compares the distribution of user review scores with the distribution of hotel average scores.
 For the curious, here are the top 10 hotels on TripAdvisor by number of reviews:
So with such kind reviewers, most hotels must have a rating over 4 and hoteliers must all love us, right? Actually, no. The average of all hotel ratings is 3.6. Here's why: some large, frequently-reviewed hotels have thousands of reviews. It is hardly surprising that the Bellagio in Las Vegas has about 250 times more reviews than say, the Cambridge Gateway Inn, an unloved motel in Cambridge, Massachusetts. It may or may not be surprising that these oft-reviewed properties tend to be well-liked by our reviewers. Surprising or not, it's true: the hotels with the most reviews have a higher average rating than the long tail of hotels, motels, B&Bs, and Inns with only a handful of reviews each.
The chart compares the distribution of user review scores with the distribution of hotel average scores.
Luxor Las Vegas
Majestic Colonial Punta Cana
Bellagio Las Vegas
MGM Grand Hotel and Casino
Excellence Punta Cana
Flamingo Hotel & Casino
Venetian Resort Hotel Casino
Hotel Pennsylvania New York
Excalibur Hotel & Casino
Treasure Island - TI Hotel & Casino
Not all of these are beloved by TripAdvisor users. The Hotel Pennsylvania drags the average down since it receives more ones than any other score. Despite that, as a group these hotels have a higher than average score. The moral of the story is that you can't extrapolate from one level of aggregation to another without knowing how much weight to give each unit. In the last US presidential election, the average state voted Republican, but the average voter voted Democrat.
Tuesday, August 23, 2011
Common Table Expressions
It's been a while since I posted. My new role at TripAdvisor has been keeping me pretty busy! My first post after a long absence is about a feature of SQL that I have recently fallen in love with. Usually, I leave it to Gordon to write about SQL since he is an expert in that field, but this particular feature is one that he doe not write about in Data Analysis Using SQL and Excel. The feature is called common table expressions or, more simply, the WITH statement.
Common table expressions allow you to name a bunch of useful subquerries before using them in your main query. I think of the common table expressions as subquerries because that is what they usually replace in my code, but they are actually a lot more convenient than subquerries because they aren't "sub". They are there at the top level so your main query can refer to them as many times as you like anywhere in the query. In that way, they are more like temporary tables or views. Unlike tables and views, however, you don't have to be granted permission to create them, and you don't have to remember to clean them up when you are done. Common table expressions last only as long as the query is running.
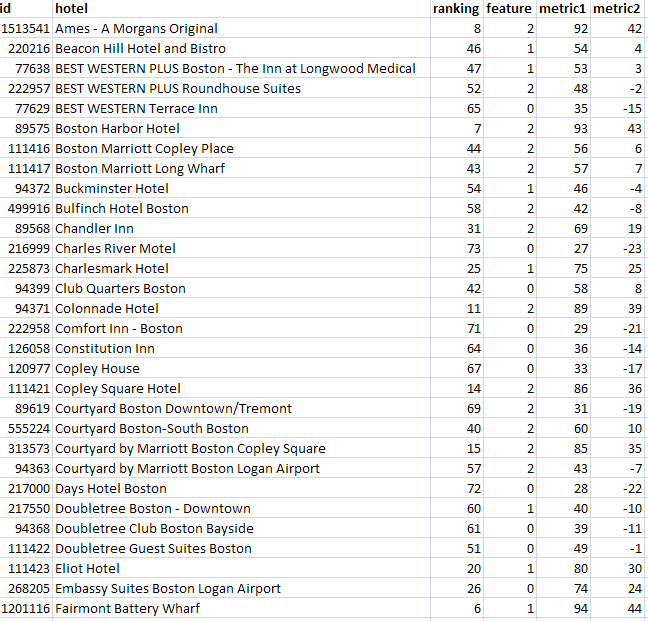
An example will help show why common table expressions are so useful. Suppose (because it happens to be true) that I have a complicated query that returns a list of hotels along with various metrics. These could be as simple as the number of rooms, or the average daily rate, or the average rating by our reviewers, or it could be a complex expression to produce a model score. For this purpose, it doesn't matter what the metric is, what matters is that I want to compare "similar" properties for some definition of similar. The first few rows returned by my complicated query look something like this:

Similar hotels have the same value of feature and similar ranking. In fact, I want to compare each hotel with four others: The one with matching feature that is next above it in rank, the one with matching feature that is next below it in rank, the one with non-matching feature that is next above it in rank, and the one with non-matching feature that is next below it in rank. Of course, for any one hotel, some of these neighbors may not exist. The top ranked hotel has no neighbors above it, for instance.
My final query involves joining the result pictured above with itself four times using non-equi joins, but for simplicity, I'll leave out the matching and non-matching features bit and simply compare each hotel to the one above and below it in rank. The ranking column is dense, so I can use equi joins on ranking=ranking+1 and ranking=ranking-1 to achieve this. Here is the query:
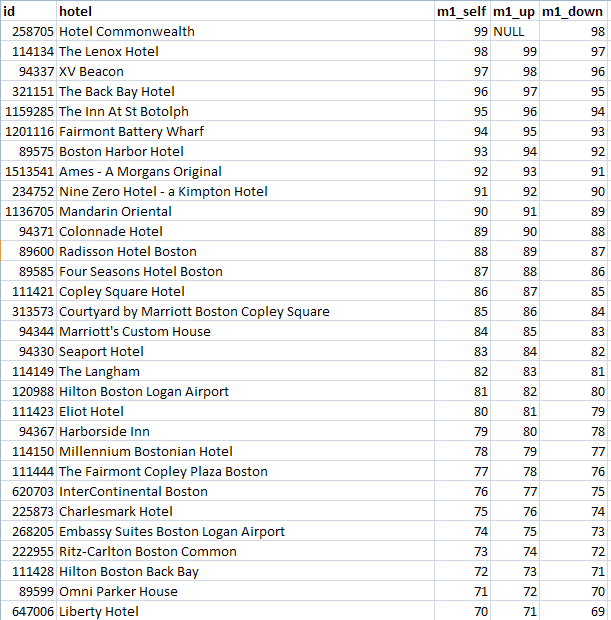
The common table expression gives my complicated query the name ranks. In the main query, ranks appears three times with aliases r0, r1, and r2. The outer joins ensure that I don't lose a hotel just because it is missing a neighbor above or below. The query result looks like this:
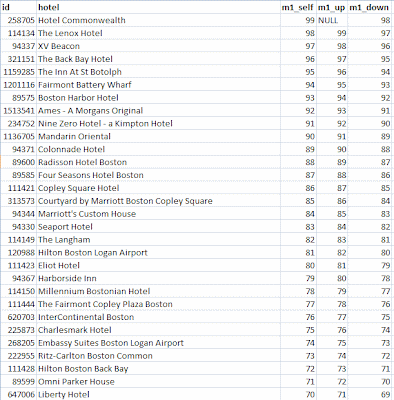
The Hotel Commonwealth has the highest score, a 99, so there is nothing above it. In this somewhat contrived example, the hotel below it is the Lenox with a score of 98 and so on down the list. To write this query using subqueries, I would have had to repeat the subquery three times which would not only be ugly, it would risk actually running the subquery three times since the query analyzer might not notice that they are identical.
Common table expressions allow you to name a bunch of useful subquerries before using them in your main query. I think of the common table expressions as subquerries because that is what they usually replace in my code, but they are actually a lot more convenient than subquerries because they aren't "sub". They are there at the top level so your main query can refer to them as many times as you like anywhere in the query. In that way, they are more like temporary tables or views. Unlike tables and views, however, you don't have to be granted permission to create them, and you don't have to remember to clean them up when you are done. Common table expressions last only as long as the query is running.
An example will help show why common table expressions are so useful. Suppose (because it happens to be true) that I have a complicated query that returns a list of hotels along with various metrics. These could be as simple as the number of rooms, or the average daily rate, or the average rating by our reviewers, or it could be a complex expression to produce a model score. For this purpose, it doesn't matter what the metric is, what matters is that I want to compare "similar" properties for some definition of similar. The first few rows returned by my complicated query look something like this:
Similar hotels have the same value of feature and similar ranking. In fact, I want to compare each hotel with four others: The one with matching feature that is next above it in rank, the one with matching feature that is next below it in rank, the one with non-matching feature that is next above it in rank, and the one with non-matching feature that is next below it in rank. Of course, for any one hotel, some of these neighbors may not exist. The top ranked hotel has no neighbors above it, for instance.
My final query involves joining the result pictured above with itself four times using non-equi joins, but for simplicity, I'll leave out the matching and non-matching features bit and simply compare each hotel to the one above and below it in rank. The ranking column is dense, so I can use equi joins on ranking=ranking+1 and ranking=ranking-1 to achieve this. Here is the query:
with ranks (id, hotel, ranking, feature, metric1, metric2)
    as(select . . .) /* complicated query to get rankings */
select r0.id, r0.hotel,
    r0.metric1 as m1_self, r1.metric1 as m1_up, r2.metric1 as m1_down
from ranks r0 /* each hotel */ left join
      ranks r1 on r0.ranking=r1.ranking+1 /* the one above */ left join
      ranks r2 on r0.ranking=r2.ranking-1 /* the one below */
order by r0.ranking
The common table expression gives my complicated query the name ranks. In the main query, ranks appears three times with aliases r0, r1, and r2. The outer joins ensure that I don't lose a hotel just because it is missing a neighbor above or below. The query result looks like this:
The Hotel Commonwealth has the highest score, a 99, so there is nothing above it. In this somewhat contrived example, the hotel below it is the Lenox with a score of 98 and so on down the list. To write this query using subqueries, I would have had to repeat the subquery three times which would not only be ugly, it would risk actually running the subquery three times since the query analyzer might not notice that they are identical.
Sunday, May 22, 2011
JMP Webcast:: Measuring What Matters
On Tuesday, May 24 at 1:00pm Eastern Daylight Time, I will be presenting a webcast on behalf of JMP, a visual data exploration and mining tool. The main theme of the talk is that companies tend to manage to metrics, so it is very important that the metrics are well-chosen. I will illustrate this with a small case study from the world on on-line retailing recommendations. A secondary theme is the importance of careful data exploration in preparation for modeling--a task JMP is well-suited to.
-Michael
Register.
-Michael
Register.
Subscribe to:
Posts (Atom)


