Friday, January 25, 2008

MapReduce and SQL Aggregations

This is another post discussing the article on MapReduce written by Professors Michael Stonebraker and David DeWitt (available here).

One of the claims that they make is:

To draw an analogy to SQL, map is like the group-by clause of an aggregate query. Reduce is analogous to the aggregate function (e.g., average) that is computed over all the rows with the same group-by attribute.

This claim is worth discussing in more detail because it is a very powerful and intuitive analogy. And, it is simply incorrect. MapReduce is much more powerful than SQL aggregations.

Another reason why I find their claim interesting is because I use the same analogy to describe MapReduce to people familiar with databases. Let me explain this in a bit more detail. Consider the following SQL query to count the number of customers who start in each month:

SELECT MONTH(c.start_date), COUNT(*)
FROM customer c
GROUP BY MONTH(c.start_date)

Now, let's consider how MapReduce would "implement" this query. Of course, MapReduce is a programming framework, not a query interpreter, but we can still use it to solve the same problem. The MapReduce framework solves this problem in the following way:

First, the map phase would read records from the customer table and produce an output record with two parts. The first part is called the "key", which is populated with MONTH(c.start_date). The second is the "value", which can be arbitrarily complicated. In this case, it is as simple as it gets. The value part simply contains "1".

The reduce phase then reads the key-value pairs, and aggregates them. The MapReduce framework sorts the data so records with the same key always occur together. This makes it easy for the reduce phase to add together all the "1"s to get the count for each key (which is the month number). The result is a count for each key.

I am intentionally oversimplified this process by describing it at a high level. The first simplification is leaving out all the C++ or Java overhead for producing the programs (although there are attempts at interpreted languages to greatly simplify this process). Another is not describing the parallel processing aspects. And yet another oversimplification is leaving out the "combine" step. The above algorithm can be made more efficient by first "reducing" the values locally on each processor to get subtotals, and then "reducing" these again. This post, however, is not about computational efficiency.

The important thing to note is the following three correspondences between MapReduce and SQL aggregates.
  1. First, MapReduce uses a "key". This key is the GROUP BY expression in a SQL aggregation statement.
  2. Second, MapReduce has a "map" function. This is the expression inside the parentheses. This can be an arbitrary function or CASE statement in SQL. In databases that support user defined functions, this can be arbitrarily complicated, as with the "map" function in MapReduce.
  3. Third, MapReduce has a "reduce" function. This is the aggregation function. In SQL, this is traditionally one of a handful of functions (SUM(), AVG(), MIN(), MAX()). However, in some databases support user defined aggregation functions, which can be arbitrarily complicated.
So, it seems that SQL and MapReduce are equivalent, particularly in an environment where SQL supports user defined functions written in an external language (such as C++, Java, or C-Sharp).

Wrong!

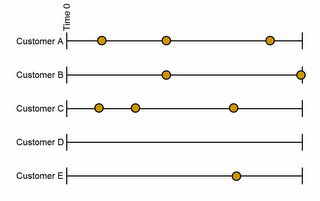
The next example extends the previous one by asking how many customers start and how many stop in each month. There are several ways of approaching this. The following shows one approach using a FULL OUTER JOIN:

SELECT m, ISNULL(numstarts, 0), ISNULL(numstops, 0)
FROM (SELECT MONTH(start_date) as m, COUNT(*) as numstarts
......FROM customer c
......GROUP BY MONTH(start_date)
.....) start FULL OUTER JOIN
.....(SELECT MONTH(stop_date) as m, COUNT(*) as numstops
......FROM customer c
......GROUP BY MONTH(stop_date)
.....) stop
.....ON start.m = stop.m

Another formulation might use an aggregation and UNION:

SELECT m, SUM(isstart), SUM(isstop)
FROM ((SELECT MONTH(start_date) as m, 1 as isstart, 0 as isstop
.......FROM customer c)
......UNION ALL
........(SELECT MONTH(stop_date) as m, 0 as isstart, 1 as isstop
........FROM custommer c)) a
GROUP BY m

Now, in both of these, there are two pieces of processing, one for the starts and one for the stops. In almost any databases optimizer that I can think of, both these queries (and other, similar queries) require two passes through the data, one pass for the starts and one pass for the stops. And, regardless of the optimizer, the SQL statements describe two passes through the data.

The MapReduce framework has a more efficient, and perhaps, even more intuitive solution. The map phase can produce two output keys for each record:
  • The first has a key that is MONTH(start_date) and the value is a structure containing isstart and isstop with values of 1 and 0 respectively.
  • The second has a key that is MONTH(stop_date) and the value are 0 and 1 respectively.
What is important about this example is not the details, simply the fact that the processing is quite different. The SQL methods describe two passes through the data. The MapReduce method has only one pass through the data. In short, MapReduce can be more efficient than SQL aggregations.

How much better becomes apparent when we look in more detail at what is happening. When processing data, SQL limits us to one key per record for aggregation. MapReduce does not have this limitation. We can have as many keys as we like for each record.

This difference is particularly important when analyzing complex data structures to extract features -- of which processing text from web pages is an obvious example. To take another example, one way of doing content filtering of email for spam involves looking for suspicious words in the text and then building a scoring function based on those words (naive Bayesian models would be a typical approach).

Attempting to do this in MapReduce is quite simple. The map phase looks for each word and spits out a key value pair for that word (in this case, the key is actually the email id combined with the word). The reduce phase counts them all up. Either the reduce phase or a separate program can then apply the particular scoring code. Extending such a program to include more suspicious words is pretty simple.

Attempting to do this in SQL . . . well, I wouldn't do it in the base language. It would be an obfuscated mess of CASE statements or a non-equi JOIN on a separate word table. The MapReduce approach is simpler and more elegant in this case. Ironically, I usually describe the problem as "SQL is not good in handling text." However, I think the real problem is that "SQL aggregations are limited to one key per record."

SQL has many capabilities that MapReduce does not have. Over time, MapReduce may incorporate many of the positive features of SQL for analytic capabilities (and hopefully not incorporate unneeded overhead for transactions and the like). Today, SQL remains superior for most analytic needs -- and it can take advantage of parallelism without programming. I hope SQL will also evolve, bringing together the enhanced functionality from other approaches.

--gordon

Wednesday, January 23, 2008

Relational Databases for Analysis

Professors Michael Stonebraker and David DeWitt have written a very interesting piece on relational databases and MapReduce (available here). For those who are not familiar with MapReduce, it is a computational framework developed by Google and Yahoo for processing large amounts of data in parallel.

The response to this article has, for the most part, been to defend MapReduce, which I find interesting because MapReduce is primarily useful for analytic applications. Both technologies make it possible to run large analytic tasks in parallel (taking advantage of multiple processors and multiple disks), without learning the details of parallel hardware and software. This makes both of them powerful for analytic purposes.

However, Professors Stonebraker and DeWitt make some points that are either wrong, or inconsequential with respect to using databases for complex queries and data warehousing.

(1) They claim that MapReduce lacks support for updates and transactions, implying that these are important for data analysis.

This is not true for complex analytic queries. Although updating data within a databases is very important for transactional systems, it is not at all important for analytic purposes and data warehousing. In fact, updates imply certain database features that can be quite detrimental to performance.

Updates imply row-level locking and logging. Both of these are activities that take up CPU and disk resources, but are not necessary for complex queries.

Updates also tend to imply that databases pages are only partially filled. This makes it possible to insert new data without splitting pages, which is useful in transactional systems. However, partially filled pages slow down queries that need to read large amounts of data.

Updates also work against vertical partitioning (also called columnar databases), where different columns of data are stored on different pages. This makes working on wide tables quite feasible, and is one of the tricks used by newer database vendors such as Netezza.


(2) They claim that MapReduce lacks indexing capabilities, implying that indexing is useful for data analysis.

One of the shortcomings of the MapReduce framework in comparison to SQL is that MapReduce does not facilitate joins. However, the major use of indexes for complex queries are for looking up values in smaller reference tables, which can often be done in memory. We can assume that all large tables require full table scans.


(3) MapReduce is incompatible with database tools, such as data mining tools.

The article actually sites Oracle Data Mining (which grew out of the Darwin project developed by Thinking Machines when I was there) and IBM Intelligent Miner. This latter reference is particular funny, because IBM has withdrawn this product from the market (see here). The article also fails to cite the most common of these tools, Microsoft SQL Server Data Mining, which is common because it is bundled with the database.

However, data mining within databases is not a technology that has taken off. One reason is pricing. Additional applications on database platforms often increase the need for hardware -- and more hardware often implies larger database costs. In any case, networks are quite fast and tools can access data in databases without having to be physically colocated with them. Serious data mining practitioners are usually using other tools, such as SAS, SPSS, S-Splus, or R.


By the way, I am not a convert to MapReduce (my most recent book is calld Data Analysis with SQL and Excel). Its major shortcoming is that it is a programming interface, and having to program detracts from solving business problems. SQL, for all its faults, is still much easier for most people to learn than Java or C++, and, if you do want to program, user-defined extensions can be quite beneficial. However, there are some tasks that I would not want to tackle in SQL, such as processing log files, and MapReduce is one scalable option for such processing.

--gordon

Monday, January 14, 2008

Data Mining to Prevent Airline Crashes

It was refreshing to spot this article in the Washington Post that uses the phrase "data mining" in the same way we do rather than as a synonym for spying or otherwise violating our civil liberties.

Airline crashes are extremely rare. Rare events pose a challenge in data mining. This article points out one solution which is to model a more common event which is sometimes a precursor to the very rare event of interest.

(Click the title of this post to go to the Washington Post article.)

Saturday, November 24, 2007

Constructing a Model Set for Reccuring Events

In the previous post, I answered a question about how to set up a model set for binary churn. It is fairly common for data miners to find ways to express almost any problem as a binary outcome since binary outcome problems are easily approached with familiar tools such as logistic regression or decision trees. The context for the questions suggests an alternate approach, however. The event of interest was the purchase of refill pages for a calendar/planner. This is an example of a recurring event. Other examples include:
  • Visits to a web page.
  • Purchases of additional minutes for a pre-paid phone plan.
  • Subscription renewals.
  • Repeat purchases.
  • Pregnancies.
  • Incarcerations.
  • Posts to a blog.
All of these are examples of counting processes. A counting process is one where each time an event occurs it increments a total count. The event frequency is governed by an intensity function which is a function of time and other covariates, much like the hazard function in survival analysis for non-recurring events. The intensity function can be estimated empirically, or it may be fit by a parametric or semi-parametric model using, for example, the SAS PHREG procedure. Either way, the data must first be transformed from the way it was probably recorded--dated transactions--to a form suitable for the required calculations.


These are customers making multiple purchases during an observation window. Each time a customer makes a purchase, a transaction record is created. When we add this data to a table in the counting process style, each customer contributes several rows. There is a row for the time from time 0, which may be the time of the initial purchase, to the second purchase, a row for the time to each subsequent purchase, and a row for the time between the final observed purchase and the end of the observation period.


Depending on the style of analysis used, each event may be seen as starting a new time 0 with the number of previous events as a covariate, or each event may be modeled separately with a customer only becoming part of the at-risk pool for event n after experiencing event n-1.
Either way, it is important to include the final censored time period. This period does not correspond to any transaction, but customers are "at risk" for another purchase during that period.

My approach to creating the table is to first create the table without the censored observations, which is reasonably straightforward. Each of these rows contains a flag indicating it is a complete, uncensored observation. Next I create just the censored observations by creating an observation going from the latest observed purchase to the end of the observation period (in this case, 22May2006). The censored rows can then be appended to the uncensored rows. These could, of course, be turned into subqueries in order to avoid creating the temporary tables.


This fully expanded version of the data is what is referred to as the counting process style of input. In a realistic situation where there might be millions of customers, it makes more sense to group by tenure so that there is one row showing how many customers made a purchase with that tenure and how many customers experienced the tenure and so could have made a purchase. This is the data needed to estimate the intensity function.
In Gordon Linoff's book, Data Analysis Using SQL and Excel, he provides sample code for making a related, but different table using the data available on the book's companion page. I reproduce it here for reference.


The code uses the DATEDIFF function to subtract a household's first order date from all its other order dates to put things on the tenure timeline. It then counts the number of second (or third, or fourth, . . .) purchases that happen at each tenure. This query does not track the population at risk so it is not the actual intensity function, but it never the less gives a nice visual image of the way intensity peaks at yearly intervals as many customers make regular annual purchases, just as the purchasers of calendars in the previous posting did.

Thursday, November 1, 2007

Constructing a model set for binary outcome churn

Yesterday I received the following question from a reader who is trying to build a churn model for a business where refill purchases are expected to occur annually. The post raises several questions including how to define churn when it happens passively, how to prepare data for a binary outcome churn model, and whether it might be more appropriate to model refills as a repeating event. Although this question happens to be about annual planning book refills, the situation is similar with prepaid phone cards, transit passes, toner cartridges, etc. I will address the issue of modeling repeating events in a follow-up post, but first I will answer the question that was actually asked.
Michael,

I need advise. I hope you do not mind me asking questions.

Our Churn variable definition is if customer did not purchased in 13 months then we consider this customer has churned.

In this situation, if I want to build a model to see who is likely to leave, my churn variable will take values …

Churn = 1 (when last purchased date > 13 month)
else Churn = 0

After building a model, my Scoring data (To figure out who is likely to leave) should be…….

1. Customers who purchased within 13 months to see who are likely to leave or

2. Entire database or maybe 4 year buyers (customers whose last purchase date is within 4 years)?? Or

3. Use Modeling file which I have used create churn model as Scoring file?

Please let me know.

Thanks.

With Best Regards,

Nilima
First some context. I know from her email address (which I have removed to protect her from spam) that Nilima works for a company that sells planners and pocket calendars. The planners have an outer cover that lasts for years. When you order a planner, it comes with a year's worth of pages. As part of the order you specify what month to start with. A year later, you should need a refill. The product is not useful without its refill pages, so if 13 months go by without an order, it is likely that the customer has been lost. (Perhaps he or she now synchronizes a PDA with Outlook, or uses Google Apps, or is now enjoying a schedule-free retirement.)

As an aside, a purely time-since-last-purchase based definition of churn would not work if the product in question were wall calendars that only cover a particular year. In that case, the definition of churn might be "hasn't made a purchase by the end of January" without regard to when the previous purchase was made. There is undoubtedly also a fair amount of seasonality in the purchase of planners--the beginning of the calendar year and the beginning of the academic year seem like likely times to make an initial purchase--but that's OK. The business problem is to identify customers likely to not refill on their anniversary. For this purpose, it is not important that some months have more of these anniversaries than others.

The Data
The questioner is not a client of ours and I have never seen her data. I will assume that she has several years of history and that there is data for every customer who ever made a purchase during that time. I will further assume that all purchases are captured and that she can reliably link a purchase to a purchaser so repeat purchases are recognized as such. The business goal is to score all active, at-risk customers with a churn probability (or, equivalently and more cheerfully, with a refill probability). Presumably, customers with a high enough churn score will be given some extra incentive to refill.

It sounds as though Nilima has already taken the first step which is to summarize the purchase transactions to create a customer signature with one row per customer and columns describing them. Possible fields include

Fields derived from purchase data
  • number of past refills
  • months since last refill
  • months since first purchase
  • original product purchased
  • number of contacts since last refill
Fields captured at registration time
  • Age at time of first purchase
  • Sex
  • Country
  • Postal code or Zip code
Fields derived from the above and in combination with census data
  • Age at scoring time
  • Zip median income
  • Zip population density
  • Zip percent foreign born
Fields that could be purchased from a data vendor
  • Estimated household income
  • Estimated number of children
  • Estimated number of cars
  • Cluster assignment (e.g. "urban achievers", "bible devotion")
Rolling Back the Clock
Building a predictive model requires data from two distinct time periods. All data is from the past. To build a predictive model, you find patterns in data from the distant past that explain results in the more recent past. The result is a model that can be applied today to predict things that will happen in the future.

In the current case, you could take a snapshot of what all active customers looked like 14 months ago as your data from the distant past. In this data set, all of the tenure fields and count fields are reset to what they looked like way back when. Some customers now considered lapsed were still active. Some customers who have now made 4 refills had only made three. Customers who are now 65 were only 63, and so forth. Your data from the recent past would then be a single flag indicating whether the customer made a refill within 13 months of his or her previous refill or initial purchase. Note that because the churn definition is in terms of months since last purchase, the calendar date when a customer becomes lapsed must be calculated separately for each customer.

SAS PROC SQL Code Example
As I said, I have not seen the data that prompted Nilima's question. I do have some similar data that I can share with readers, however. Gordon Linoff and I teach a 2-day class on Applying Survival Analysis for Business Time-to-Event Problems. For that class we use a customer signature with a row for each subscriber, past and present, of a mobile phone company. You can get the data by registering on our web site.

The focus of the class is on calculating hazard probabilities for each tenure and using them to create survival curves that can be used to predict a subscriber's remaining lifetime and create subscriber level forecasts. If we wanted to use that data for a binary outcome churn model, we would have to roll back time as described above. The following SAS code creates a dataset of customers who were active 100 days before the extract or cutoff date. Time is rolled back so that subscribers appear as they did at the observation date. In particular, the subscriber's tenure and age are defined as of the observation date.

The code does a few other interesting things that may be worth noting. In the mobile telephony industry, handset is a known driver of churn. Subscribers know that they can get a new, cooler phone by signing up with a competitor as a new subscriber. Subscribers with uncool phones are most at risk, but which phones are the least cool is constantly changing over time. Therefore, rather than trying to incorporate the handset model into the model, we incorporate the churn rate associated with each model in the 100 days before the observation date by counting the number of people who stopped with each model and dividing by the number of people carrying each model.

Another big factor in churn is whether subscribers are on or off contract. Subscribers on contract must pay a fee to cancel their subscriptions. This code calculates two flags--one indicating whether the subscriber is off-contract as of the observation date and another indicating whether the subscriber is scheduled to go off contract (and so become more likely to churn) before the cutoff date.

The code creates 3 future variables, any of which could be the target for a binary outcome churn model. FutureCHURN is true for anyone who stopped for any reason between the observation date and the cutoff date. FutureVOLUNTARY is true for anyone who stopped voluntarily and FutureINVOLUNTARY is true for anyone who stopped involuntarily.

SQL code

Thursday, September 27, 2007

Which movies did 305344 fail to rate?

Originally posted to a previous version of this blog 27 April 2007.

I expected that the 117 movies not rated by someone or something that seems to rate every movie would have few raters and an earliest rating date close to the cutoff date for the data. That would be consistent with a rating program of some sort that scores the entire database periodically. This did not prove to be the case. The list of movies customer 305344 failed to rate includes Dr. Shivago, Citizen Kane and A Charlie Brown Christmas.

Unlike most of the recent questions, this one cannot be looked up in the rater signature or the movie signature because this information has been summarized away. Instead I used a query on the original training data that has all the rating transactions. Later, I looked up the earliest rating date for each movie not rated by the alpha movie geek to test my hypothesis that they would be movies only recently made available for rating.


select t.movid from
(select r.movid as movid, sum(custid=305344) as geek
from netflix.train r
group by movid) t
where t.geek = 0


The most rated movies not rated by the alpha rater geek


titlen_ratersearliest
Mystic River143,6822003-09-20
Collateral132,2372004-05-10
Sideways117,2702004-10-22
The Notebook115,9902004-05-19
Ray108,6062004-10-22
The Aviator108,3542004-11-30
Million Dollar Baby102,8612004-11-16
Hotel Rwanda92,3452004-12-09
The Hunt for Red October83,2491999-12-17
12 Monkeys76,4751999-12-30
Crash65,0742005-04-14
Citizen Kane61,7582001-03-17
The Saint28,4482000-01-05
Doctor Zhivago17,7852000-01-12
Hackers17,4522000-01-06
The Grapes of Wrath16,3922001-03-18
The Pledge10,9692001-01-21
A Charlie Brown Christmas7,5462000-08-03
The Tailor of Panama7,4212001-03-28
The Best Years of Our Lives7,0312000-01-06

How weird is customer 305344, the rating champion?

Originally posted to a previous version of this blog on 27 April 2007.

305344


This most prolific of all customers has rated 17,653 of the 17,770 movies; all but 117 of them. As with the last super rater we examined, his ratings are heavily skewed toward the negative end of the scale. Of course, anyone forced to see every movie in the Netflix catalog would probably hate most of them. . .